


Abstract: A consistent method to measure the decadal trend of global temperatures is described. This is based on the geometry of a level 4 icosahedral grid. The fixed geometry allows us to integrate over a 10 year period for each bin and then measure the decadal average temperature anomaly on a 1961-1990 baseline. The decadal average is a smooth function of time which cleanly integrates short term effects like El Nino. This then allows us to directly measure the transient climate response (TCR), defined as the temperature increase on a doubling of CO2 from pre-industrial levels. The result for TCR is 2.9 ± 0.2C and also predicts that the Paris Agreement will be breached in 2032.
The largest uncertainty in the effects of climate change is an accurate measurement of the sensitivity of the earth’s temperature to increasing CO2 levels (climate sensitivity). This is usually defined as the increase in the global temperature following a doubling of CO2 levels (560ppm). If the sensitivity is high ( > 3C ) then severe action now could be justified despite the negative economic consequences, if such action would then avoid even worse economic disruption if ignored. However if instead Climate Sensitivity is lower ( < 3C) then we have sufficient time to plan an effective future energy transition based around nuclear power and renewables, thereby maintaining living standards for the longer term.
To answer this dilema the key question then is whether we can accurately measure the value for transient climate response (TCR) from the current global temperature data? The accepted answer to this currently is that we can’t rely on a single year’s temperature because the value is also affected by natural cycles such as el Nino, the North Atlantic Oscillation and volcanic eruptions. Despite this many climate scientists and activists often assume the worst case scenario based on a single year’s weather extremes to push for immediate curbs on fossil fuels as a precautionary measure. Instead we present here a direct way to measure the earth’s climate sensitivity which avoids these natural short term climate effects. This method is based on the geometry of Icosahedral grids which can represent any spherical object such as the earth in a consistent and stable way. This then allows us to integrate the temperature data for each occupied cell over a decadal (10 year) period just as easily as as if it was a noisy single year period. Figures 1 and 2 shows how the icosahedral mesh is generated.
Figure 1. Generating a regular triangular mesh from an Icosahedron
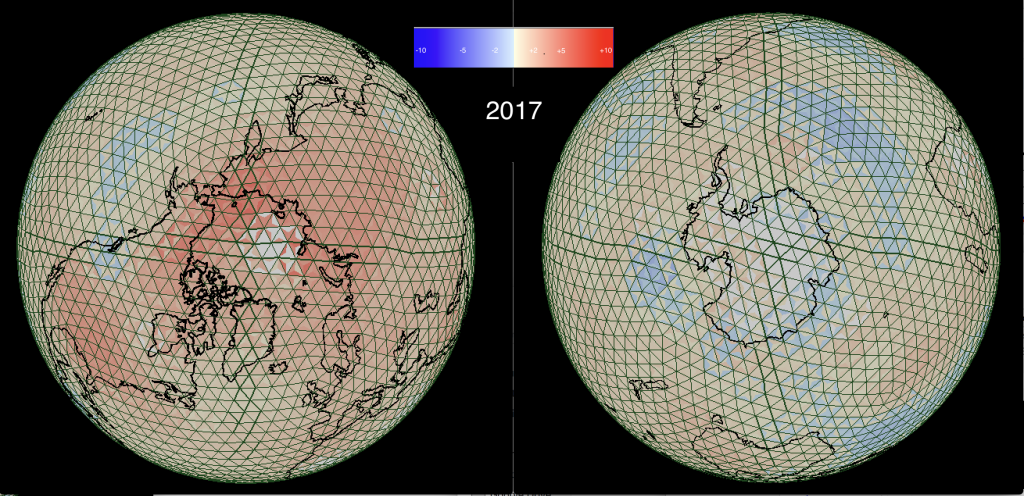
Fig 2. The Icosahedral grid used in this work is shown above, demonstrating how the poles are handled in a consistent way
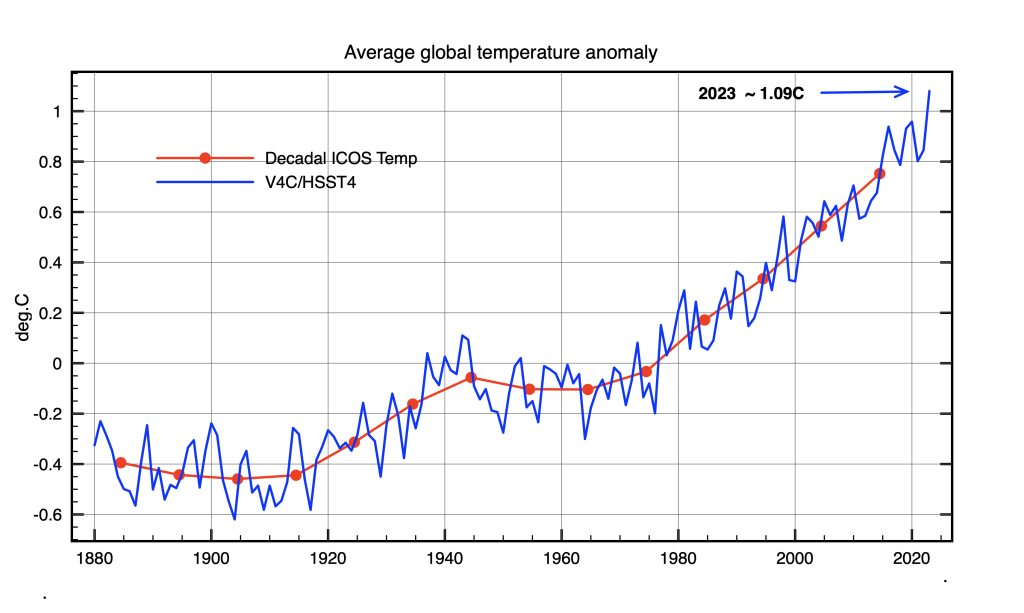
The temperature data source used for this work is GHCNV4 for land data and HadSST4 for the Ocean temperature data. The decadal average simply averages all recorded temperature anomalies (on a 1961-1990 baseline) for each bin over successive 10 year periods. Hence we get the average global temperature anomaly for the 1960s, 1970s etc. These results are remarkably smooth because they integrate locally over ENSO and other short term affects. Figure 3 shows a comparison between the decadal results and the annual results showing just how effective the decadal averaging really is.
Fig 3. Annual temperature trends updated for October 2023 compared to the underlying decadal trends. The underlying trend is clearly identified.
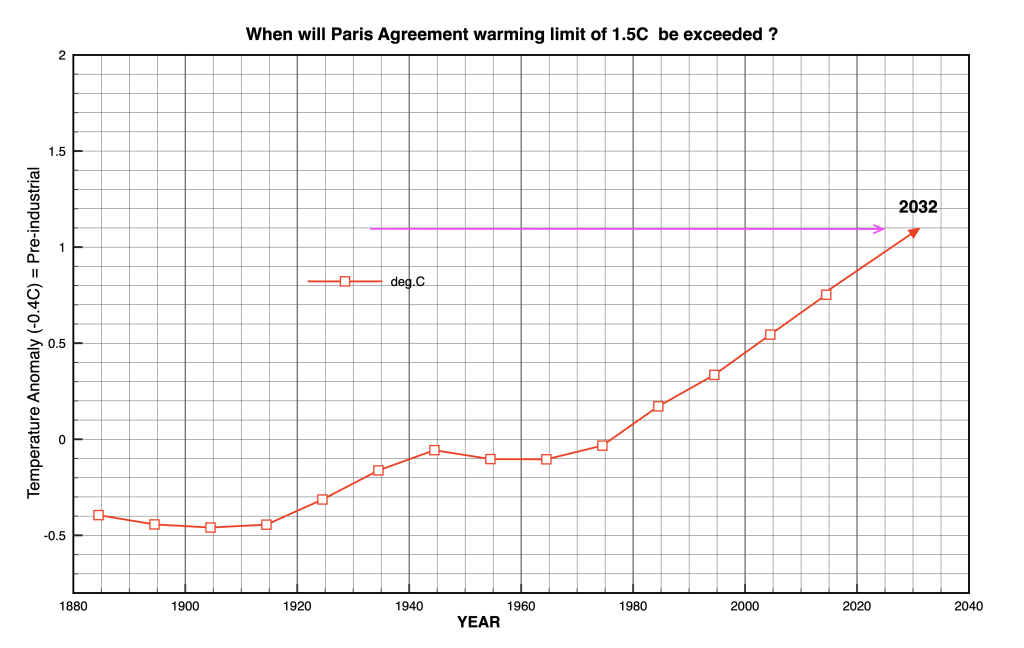
These decadal temperatures can already be used to clearly predict that the Paris Agreement (to limit warming to 2C relative to pre-industrial temperatures) will be breached in 2o32.
Fig 4. The observed stable decadal trend shows that the Paris Agreement to limit warming to 1.5C since the preindustrial level (-0.5) will very likely be exceeded in 2032
This demonstrates how effective the decadal integration method is at isolating the underlying enhanced Anthropogenic CO2 greenhouse effect from natural background noise (ENSO etc.).
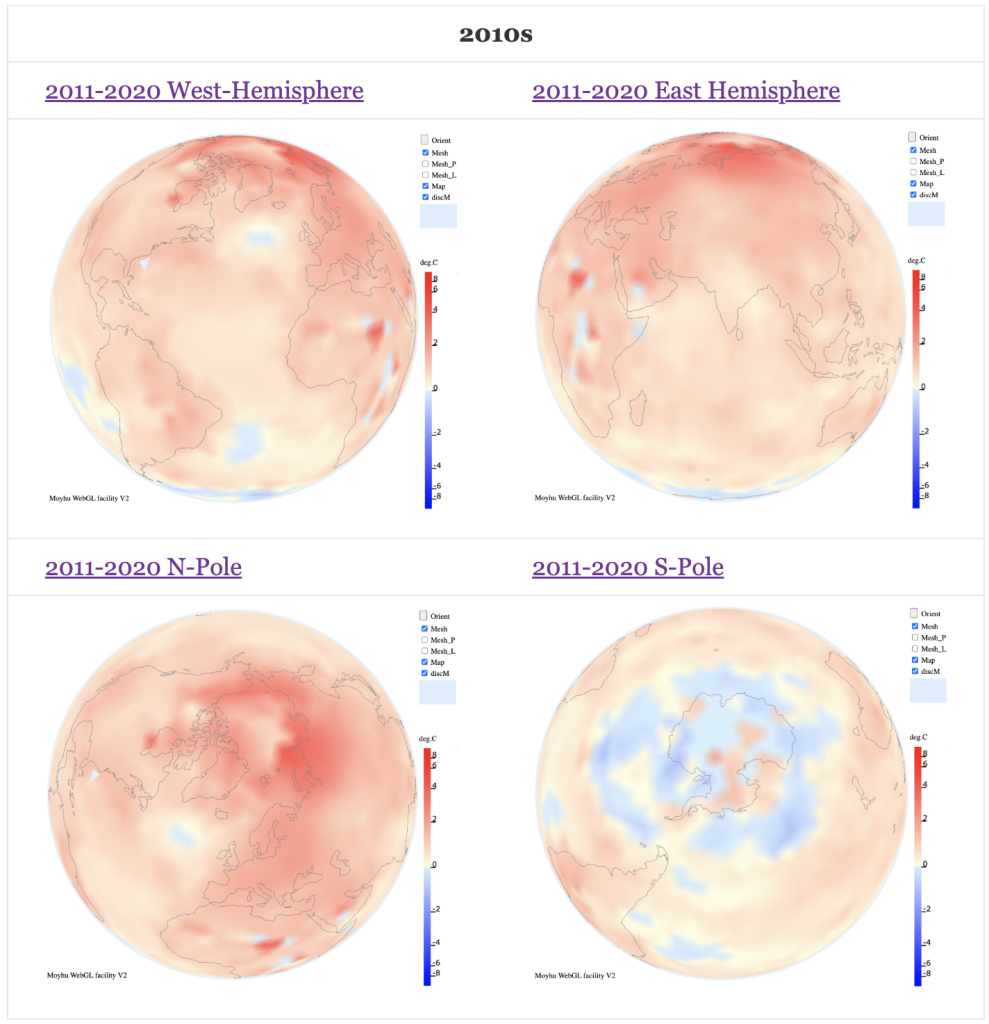
An example of the detailed temperature distributions for the 2011-2020 decade are shown in Figure 4 using spherical icosahedral binning.
Climate Sensitivity.
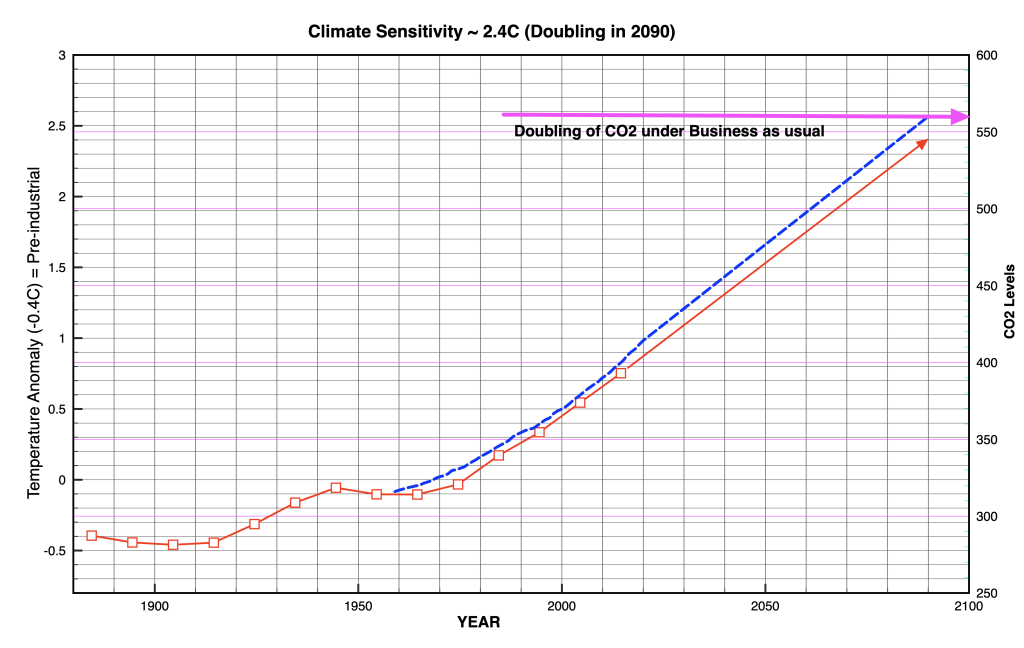
The “Transient Response” (TCR) is defined as the temperature rise after a doubling of CO2 levels averaging out other transient effects like El Nino and NAO. Therefore we can measure this by assuming a business as usual scenario with continuing carbon emissions, and project future CO2 levels based on the observed dependence of global temperatures on CO2 levels in the atmosphere. For this study we use the measured decadal temperature dependence and extrapolate this forward to 2100 compared to a similar extrapolation of CO2 trends as measured in Mauna Loa. The results are shown in Figure 2.
Extrapolation of decadal temperatures to a doubling of CO2 levels based on a continuing trend of the observed decadal temperatures
This result gives a Transient Climate Response of 2.9C with an estimated error of 0.o2C which is right on the line for early action. Remember that this is the worst possible case with no action taken to mitigate emissions until the end of this century. The scenario is also unrealistic because there are insufficient reserves of fossil fuels to maintain this pace, therefore we will anyway have to replace most of them anyway. The logical answer to our energy needs for the future is to develop further Nuclear Power and eventually Nuclear Fusion within the next decade.