

By Andy May
Available in German, translated by Christian Freuer, here.
We are constantly told that the rate of global mean sea level (GMSL) rise is accelerating. Is it? How definitive is the evidence? If it is accelerating, why? Is the acceleration dangerous?
The usual assumption is that it is rising mostly because of man-made global warming and the melting of glaciers and the polar icecaps. Is that true? We will examine the evidence and see what we can figure out.
Dangendorf, et al. report that:
“We find a persistent acceleration in GMSL since the 1960s and demonstrate that this is largely (~76%) associated with sea-level changes in the Indo-Pacific and South Atlantic. We show that the initiation of the acceleration in the 1960s is tightly linked to an intensification and a basin-scale equatorward shift of Southern Hemispheric westerlies, leading to increased ocean heat uptake, and hence greater rates of GMSL rise, through changes in the circulation of the Southern Ocean.”
In absolute elevation, sea level is not the same in every ocean basin, this is due to the shape of the ocean basins, the individual ocean basin temperature, and in the strength and direction of the prevailing winds over the basin. Thus, the acceleration of sea level change in each basin is different, the global mean sea level is a combination of all the changes in each basin and just reporting (or discussing) GMSL masks a lot of complexity.
Dangendorf, et al. observe a persistent acceleration in global mean sea level since the 1960s and conclude that the acceleration is due to a shift in the prevailing Southern Hemisphere winds, not melting ice. In fact, they find that melting ice significantly contributed to the high rate of sea level rise in the 1930s, when greenhouse gas emissions were much lower than today, but had “zero to negative contributions to the acceleration coefficients between the 1940s and the early 1990s.”
They also report that the modern (1968-2015) acceleration in “global” sea level is not global at all, it is largely a rise in the acceleration of sea level rise in specific regions. No acceleration is detected in the eastern Pacific or the Arctic Ocean, and deceleration was detected in the Southern Ocean. Thus, the regions that should be most affected by melting ice, the Arctic and the Southern Ocean, show no acceleration.
This suggests that the currently observed acceleration is due to atmospheric circulation changes and not due to global warming or greenhouse gases. Major global wind circulation changes occur with a period of about 65 years and these cause changes in global temperatures as shown in figure 1.
While the AMO Index is not exactly the same as the 60-70-year global climate oscillation, usually called the climate stadium wave, it is similar and the AMO is an important component of the stadium wave (Wyatt M. G., 2012c) and (Wyatt & Curry, 2014). Notice that the AMO shows a minimum between 1910 and 1925 and between 1970 and 1980 and that these minima approximately coincide with lows in the HadCRUT4 global average surface temperature after it is detrended.
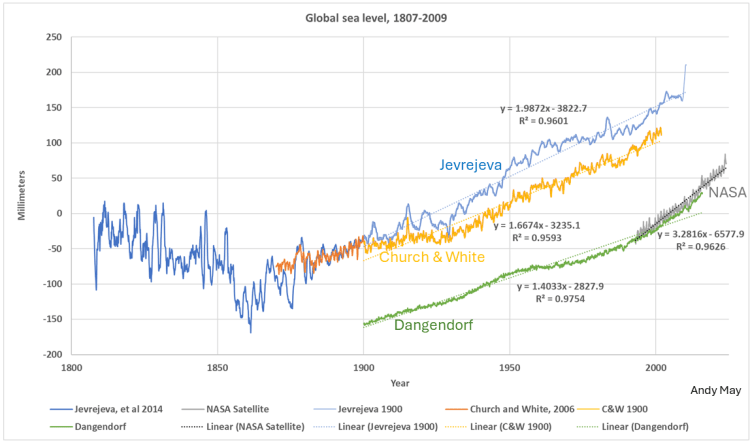
Various estimates of sea level rise are shown in figure 2, including the Dangendorf et al. estimate.
The first thing we notice in figure two is that from 1900 to 2000 all the long-term rates of sea level rise are reasonably linear with rates between 1.4 and 2.0 mm/year or 5 to 8 inches per century. The second thing we notice is there is a similar cyclical pattern of increasing and decreasing acceleration of sea level rise in all the reconstructions. All show acceleration from about 1920 to around 1950-1960, followed by deceleration to the early 1990s, then acceleration again after the 1990s. Coincidentally, the satellite record begins as the cyclical acceleration starts up in the early 1990s.
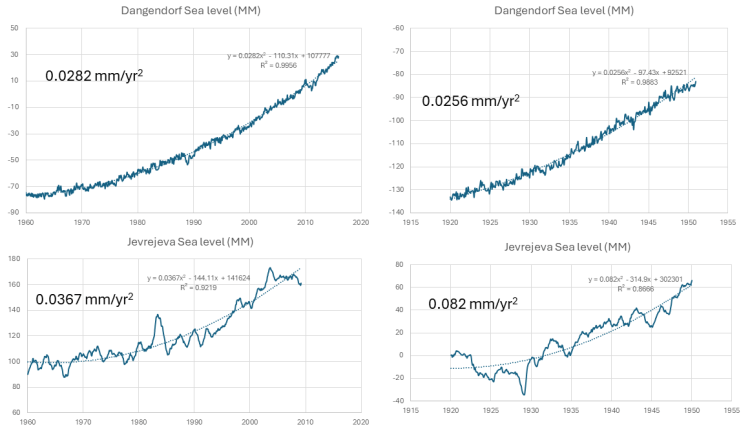
According to Dangendorf et al., the acceleration in the rate of sea level rise observed since the 1960s (near the peak of the cycle) is not significantly larger than the acceleration noticed in 1920s and 1930s. It seems likely that the natural climate pattern seen in figure 1 is heavily influencing the sea level rise acceleration in both periods of acceleration. A comparison of the acceleration from 1960-2016 to that observed from 1920 to 1950 is shown in figure 3 for the Dangendorf hybrid model and the Jevrejeva tide gauge reconstruction.
In figure 3 it is clear that the Jevrejeva sea level rise record is much more detailed and less processed than the complex hybrid Dangendorf reconstruction, but both show similar rates of acceleration for the respective periods. The largest rate of acceleration is the Jevrejeva rate for 1920 to 1950 and the smallest is the Dangendorf rate for the same period. The modern Dangendorf rate of acceleration is modest and smaller than the modern Jevrejeva rate.
As noted in Dangendorf, et al. the rate of acceleration in the 1920 to 1950 period is similar to the rate in the modern period and the Jevrejeva data from 1920 to 1950 suggests the acceleration in that period was higher than the modern period. Since the early 20th century rate of acceleration was probably unaffected by greenhouse gas emissions there is no reason to believe the modern period of acceleration is any different.
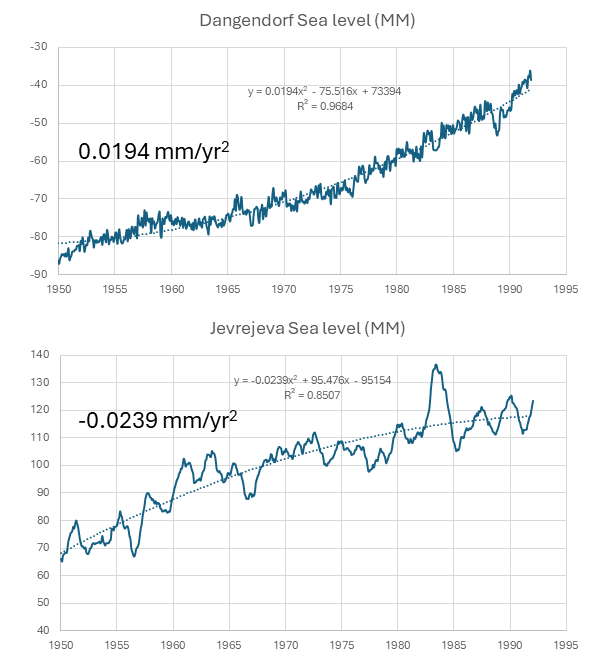
Greenhouse gas emissions from 1950 to 1990 were higher than from 1920 to 1950, yet the acceleration of the rate of sea level rise was lower then and possibly negative, as shown in figure 4.
The very heavily processed Dangendorf et al. sea level record shows a low rate of acceleration from 1950 to 1991, but the Jevrejeva tide gauge record actually shows deceleration over the period.
Discussion and Conclusions
There are specific breakpoints in climatic trends at around 1912 and 1972 as seen in the AMO Index in figure 1, these breakpoints can also be seen in the detrended HadCRUT4 global mean surface temperature record. For more information on climate breakpoints, aka climate shifts see here, here, and here.
Breaks also occur in the rate of sea level rise as shown in figure 2, but they are shifted slightly to about ±1928 and ±1991. All the sea level rise records in figure 2 show these breakpoints, with varying degrees of clarity.
It is unclear why the climate changes at these times, or if the changes are related to the changes in the rate of sea level rise. This is an area that needs more research. But these plots suggest that the acceleration of sea level rise changes on a cycle of 60-70 years. The changes follow a similar pattern to the rate of changes in the global surface temperature and the Atlantic Multidecadal Oscillation.
Dangendorf et al. believe that the 20th century changes in the acceleration of sea level rise are tightly linked to changes in atmospheric circulation, especially circulation in the Pacific and Southern Oceans. We see no reason to disagree with this opinion. Changes in the acceleration of sea level rise do not appear to be related to greenhouse gas emissions or human activities.
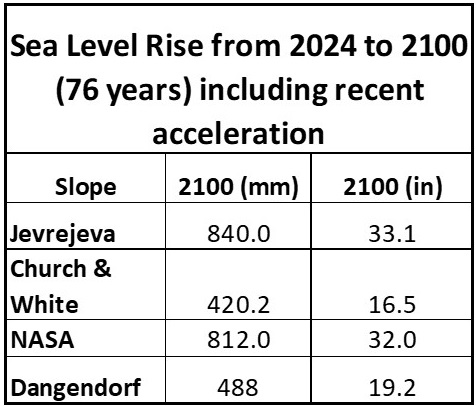
What if there are no periods of slowing acceleration, or any actual deceleration in sea level rise in this century? In other words, what if the current naturally “juiced” rate of acceleration since 1960 continues to 2100? How high would global mean sea level rise? Table 1 does that calculation using the data for each global sea level reconstruction discussed in this post. The functions used in the Jevrejeva and Dangendorf calculations are given in figure 3 on the left side. For the other functions used see the supplementary spreadsheet linked at the end of this post.
As Table 1 shows, if the observed acceleration since the most recent upswing around 1960, in each reconstruction, is extrapolated to 2100 the sea level rise is only 16 to 33 inches. This is less than the global average daily tide and not a problem for anyone. The naturally juiced acceleration since 1960 is very unlikely to continue to 2100, it should swing back to a slower acceleration soon, just as it did sometime between 1955 and 1965.
A spreadsheet with the data used to make the figures and table can be downloaded here.
Download the bibliography here.